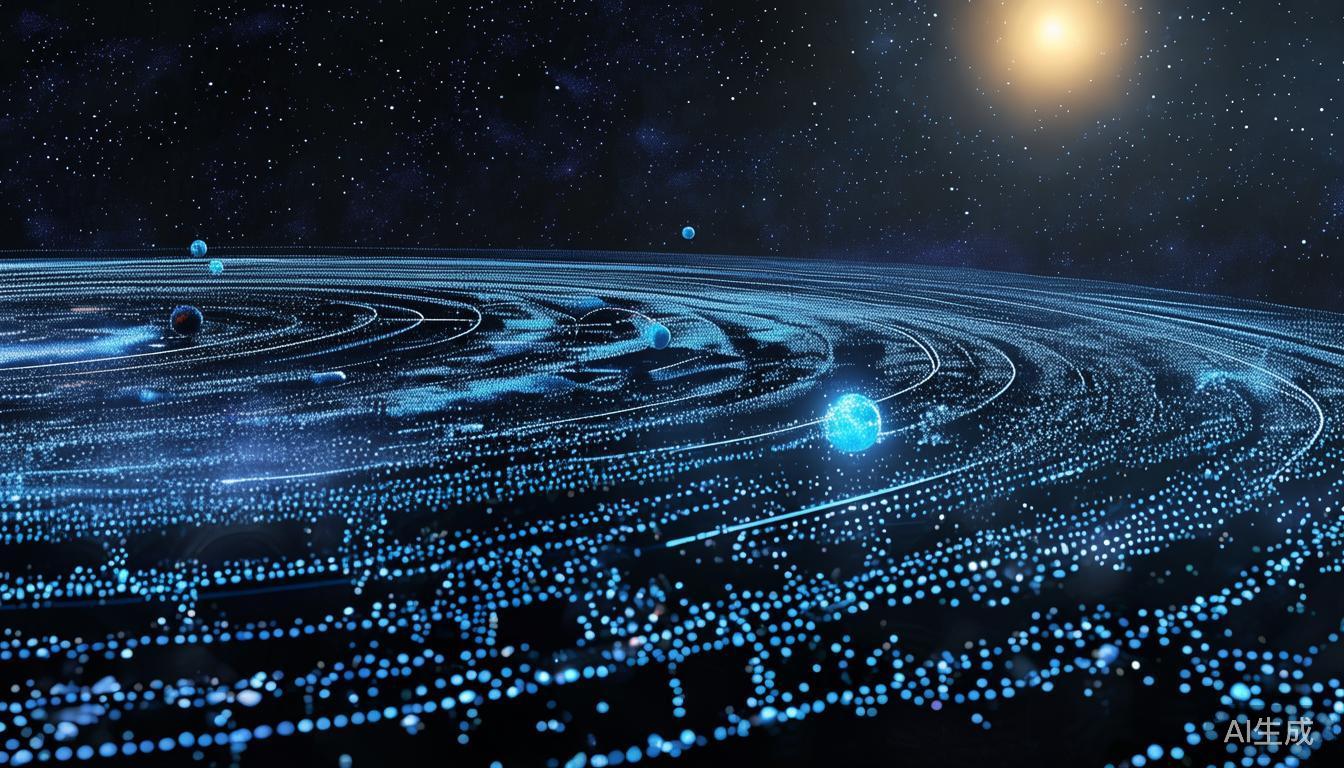
实时太阳系可视化:包含52.6万小行星和所有已追踪卫星
互联网上充斥着融合科技、科学与艺术的迷人项目。其中一个最近引起Hacker News社区关注的项目,为我们提供了令人难以置信的太阳系实时可视化,其中包含超过52.6万颗小行星和所有当前正在追踪的卫星。该项目不仅证明了现代网络技术的强大能力,还为任何对天文学感兴趣的人提供了一个独特的教育工具。
项目介绍:动态太阳系模型
该项目托管在space.bl2.net,呈现了一个动态且交互式的太阳系模型。它包含:
- 所有行星,从水星到海王星,均有精确的轨道参数。
- 超过52.6万颗小行星,每颗都有其自身的轨迹和轨道数据。
- 所有已追踪卫星,包括空间站、探测器以及铱星星座。
- 实时更新,显示所有天体的当前位置。
该可视化通过WebGL在浏览器中渲染,无需专业软件即可访问。这种做法使得用户体验流畅且引人入胜,即使是普通用户也能轻松使用。
技术深度解析
该项目利用了多种尖端网络技术,以实现令人印象深刻的细节和性能。以下是关键组件的详细分析:
WebGL渲染
WebGL是一种强大的图形API,允许在浏览器中直接进行硬件加速的3D渲染。该项目使用WebGL以高保真度渲染太阳系,实现平滑动画和行星的详细纹理。
// 设置WebGL上下文的示例
const canvas = document.createElement('canvas');
const gl = canvas.getContext('webgl');

if (!gl) {
  console.error('您的浏览器不支持WebGL。');
}

// 继续进行WebGL设置和渲染
实时数据源
该项目依赖于来自多个天文数据库的实时数据源,以保持行星、小行星和卫星位置的准确性。这些数据可能通过AJAX或WebSocket获取,以确保可视化始终是最新的。
// 通过AJAX获取小行星数据的示例
function fetchAsteroidData() {
  const xhr = new XMLHttpRequest();
  xhr.open('GET', 'https://api.asteroids.net/data', true);
  xhr.onload = function() {
    if (xhr.status === 200) {
      const asteroidData = JSON.parse(xhr.responseText);
      updateAsteroids(asteroidData);
    } else {
      console.error('获取小行星数据失败。');
    }
  };
  xhr.send();
}

function updateAsteroids(data) {
  // 更新可视化中小行星位置的逻辑
}
性能优化
鉴于渲染对象的数量巨大(仅小行星就超过52.6万颗),性能优化至关重要。该项目可能采用了以下技术:
- 细节层次(LOD):当物体距离较远时,以较低细节渲染。
- 剔除:不渲染视野之外的物体。
- 批处理:将多个物体组合为单个绘制调用以减少开销。
// 简单LOD实现的示例
function renderPlanet(planet) {
  if (planet.distance > 100) {
    // 渲染低细节版本
  } else {
    // 渲染高细节版本
  }
}
教育与科研价值
除了是一个视觉上令人惊叹的项目,太阳系可视化还具有显著的教育和科研价值:
可访问性
通过交互式网络应用程序使数据可访问,该项目降低了学习天文学的门槛。学生、教育工作者和爱好者无需昂贵的软件或望远镜即可探索太阳系。
实时数据
可视化的实时特性使用户能够观察太阳系的动态变化。例如,他们可以看到小行星如何穿越轨道、卫星如何发射和退役,以及行星如何相对彼此移动。
研究工具
对于天文学家和研究人员而言,该项目可以作为一个有价值的工具来可视化和分析天文数据。能够同时追踪数千个物体的位置,可以提供有关轨道力学、小行星轨迹和卫星部署的见解。
社区反响
该项目在Hacker News上获得了积极关注,用户称赞其雄心、技术实力和教育潜力。一位评论者指出:
"太令人难以置信了!我一直想在一个地方看到所有的小行星和卫星。实时更新使其更加引人入胜。"
另一位用户强调了其教育价值:
"我正在用这个教我的学生轨道力学。能够实时看到一切移动是无价的。"
总结
space.bl2.net上的太阳系可视化项目,是科技与科学交汇时所能取得的杰出成果的典范。它不仅提供了一个引人入胜且具有教育意义的工具来探索太阳系,还展示了现代网络技术在处理复杂数据和提供高性能可视化方面的强大能力。对于任何对天文学感兴趣或被宇宙奇迹所吸引的人来说,这个项目都值得一看。
Real-Time Solar System Visualization with 526k Asteroids and All Tracked Satellites
The internet is filled with fascinating projects that blend technology, science, and art. One such project, which recently caught the attention of the Hacker News community, offers an incredible real-time visualization of our solar system, complete with over 526,000 asteroids and every satellite currently being tracked. This project not only serves as a testament to the power of modern web technologies but also provides a unique educational tool for anyone interested in astronomy.
The Project: A Dynamic Solar System Model
The project, hosted at space.bl2.net, presents a dynamic and interactive model of the solar system. It includes:
- All planets, from Mercury to Neptune, with accurate orbital parameters.
- Over 526,000 asteroids, each with its own trajectory and orbital data.
- All tracked satellites, including space stations, probes, and Iridium constellations.
- Real-time updates, showing the current positions of all celestial bodies.
The visualization is rendered in the browser using WebGL, making it accessible without the need for specialized software. This approach allows for a seamless and engaging experience, even for casual users.
Technical Deep Dive
The project leverages several cutting-edge web technologies to achieve its impressive level of detail and performance. Here’s a closer look at the key components:
WebGL for rendering
WebGL is a powerful graphics API that allows for hardware-accelerated 3D rendering directly in the browser. The project uses WebGL to render the solar system with high fidelity, enabling smooth animations and detailed textures for the planets.
// Example of setting up a WebGL context
const canvas = document.createElement('canvas');
const gl = canvas.getContext('webgl');

if (!gl) {
  console.error('WebGL is not supported by your browser.');
}

// Continue with WebGL setup and rendering
Real-Time Data Feeds
The project relies on real-time data feeds from various astronomical databases to keep the positions of planets, asteroids, and satellites accurate. This data is likely fetched using AJAX or WebSockets to ensure the visualization remains up-to-date.
// Example of fetching asteroid data via AJAX
function fetchAsteroidData() {
  const xhr = new XMLHttpRequest();
  xhr.open('GET', 'https://api.asteroids.net/data', true);
  xhr.onload = function() {
    if (xhr.status === 200) {
      const asteroidData = JSON.parse(xhr.responseText);
      updateAsteroids(asteroidData);
    } else {
      console.error('Failed to fetch asteroid data.');
    }
  };
  xhr.send();
}

function updateAsteroids(data) {
  // Logic to update asteroid positions in the visualization
}
Performance Optimization
Given the sheer number of objects being rendered (526,000 asteroids alone), performance optimization is crucial. The project likely employs techniques such as:
- Level of Detail (LOD): Rendering objects with lower detail when they are farther away.
- Culling: Not rendering objects that are outside the field of view.
- Batching: Grouping multiple objects into a single draw call to reduce overhead.
// Example of a simple LOD implementation
function renderPlanet(planet) {
  if (planet.distance > 100) {
    // Render low-detail version
  } else {
    // Render high-detail version
  }
}
Educational and Scientific Value
Beyond being a visually stunning project, the solar system visualization has significant educational and scientific value:
Accessibility
By making the data accessible through an interactive web application, the project lowers the barrier to entry for learning about astronomy. Students, educators, and enthusiasts can explore the solar system without needing expensive software or telescopes.
Real-Time Data
The real-time aspect of the visualization allows users to observe the dynamic nature of the solar system. For example, they can see how asteroids cross orbits, how satellites are launched and decommissioned, and how the planets move relative to each other.
Research Tool
For astronomers and researchers, the project can serve as a valuable tool for visualizing and analyzing celestial data. The ability to track the positions of thousands of objects simultaneously can provide insights into orbital mechanics, asteroid trajectories, and satellite deployments.
Community Response
The project received positive attention on Hacker News, with users praising its ambition, technical prowess, and educational potential. One commenter noted:
"This is incredible! I've always wanted to see all the asteroids and satellites in one place. The real-time updates make it even more fascinating."
Another user highlighted the educational value:
"I'm using this with my students to teach them about orbital mechanics. The ability to see how everything moves in real-time is invaluable."
Takeaway
The solar system visualization project at space.bl2.net is a remarkable example of what can be achieved when technology and science intersect. It not only provides an engaging and educational tool for exploring the solar system but also demonstrates the power of modern web technologies to handle complex data and deliver high-performance visualizations. For anyone interested in astronomy or just fascinated by the wonders of the universe, this project is a must-see.